


It works like a magic!
As a trader, I found this tool useful for spotting market trends and making informed decisions. The real-time data and clear chart patterns help identify potential trade opportunities.
INSTANT DOWNLOAD!
Your price: $9.00
Content: Indicators: !!!-MT4 X-BORDERS-48.ex4, !!!-MT4 X-CCI TREND-48.ex4, !!!-MT4 X-POWERMETER-48.ex4, !!!-MT4 X-STOCH-48.ex4, !!!-MT4 X-SYMBOL CHANGER-48.ex4, !!!-MT4 X-XARDFX-48.ex4 (Unlocked-unlimited), Template: !!!X-XARDFX-48.tpl, NO MANUAL.
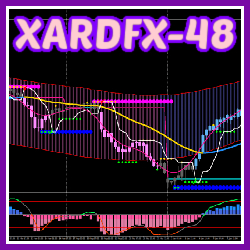
 Trading Strategy: Setup XARDFX-48
Timeframes:
-
Primary: 4-hour chart for overall trend and setup.
-
Secondary: 1-hour chart for cycle identification (using pink and blue markers).
-
Entry Timing: 15-minute chart for precise entry markers (yellow and green).
Key Concepts:
-
Cycle Identification (1H Markers):
-
Pink Marker: Down cycle — signals bearish momentum.
-
Blue Marker: Up cycle — signals bullish momentum.
-
-
Entry Signals (15min Markers):
-
Green Marker: Buy signal — enter long positions on strength and support.
-
Yellow Marker: Sell signal — enter short positions on weakness and resistance.
-
Trade Rules:
-
Buy Trades:
-
Look for green markers on the 15-minute chart above the trend line on the 4-hour chart.
-
Confirm strength by ensuring price is on or above a support level.
-
Multiple entries allowed at subsequent green markers within the up cycle.
-
-
Sell Trades:
-
Look for yellow markers on the 15-minute chart below the trend line on the 4-hour chart.
-
Confirm weakness by ensuring price is at or below a resistance level.
-
Multiple entries allowed at subsequent yellow markers within the down cycle.
-
Visual Aids:
-
The 4-hour candles are color-coded to guide decision making (colors not specified but presumably correlate with cycle or trend status).
Summary:
-
Use 4H chart for overall trend direction and support/resistance with trend line reference.
-
Use 1H markers (pink/blue) to identify market cycle (down/up).
-
Use 15min markers (yellow/green) to time precise multiple entries for buy or sell, depending on cycle and position relative to trend line.
-
Buy above trend line on green markers; sell below trend line on yellow markers.