INSTANT DOWNLOAD!
Price: $15.00
Indicator: RSIScanner Plus.ex4 v1.4 (Unlocked MT4 Build 1430+), UserGuide: RSIScanner Plus v1.4.pdf.
RSI Scanner Plus Indicator Overview
The RSI Scanner Plus Indicator is a versatile tool designed to enhance your trading by scanning multiple symbols and timeframes for RSI values. It not only provides real-time RSI data but also displays trend lines on the chart, helping you make informed trading decisions.
Key Features:
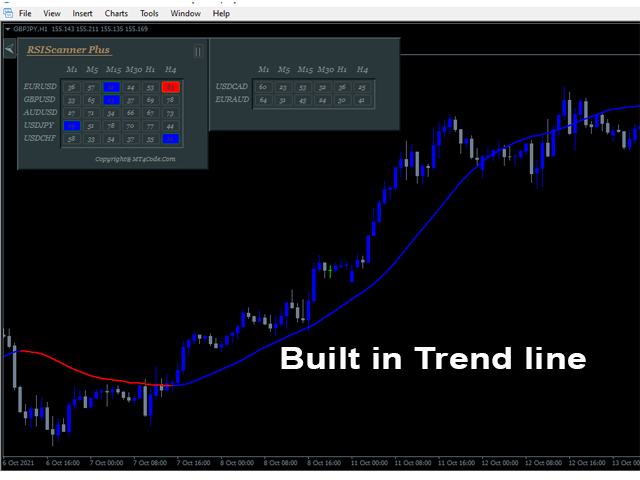
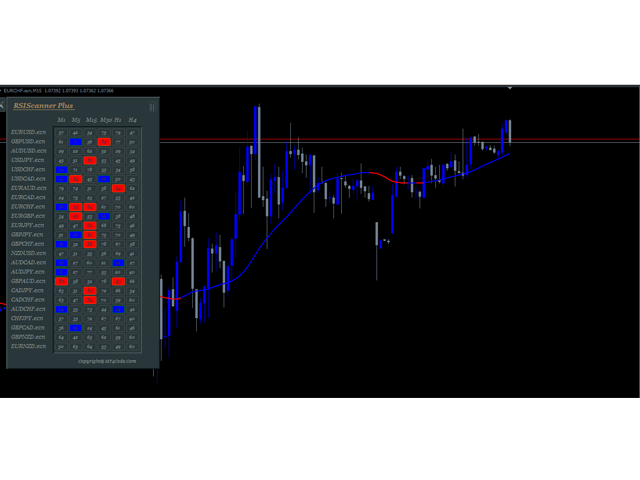
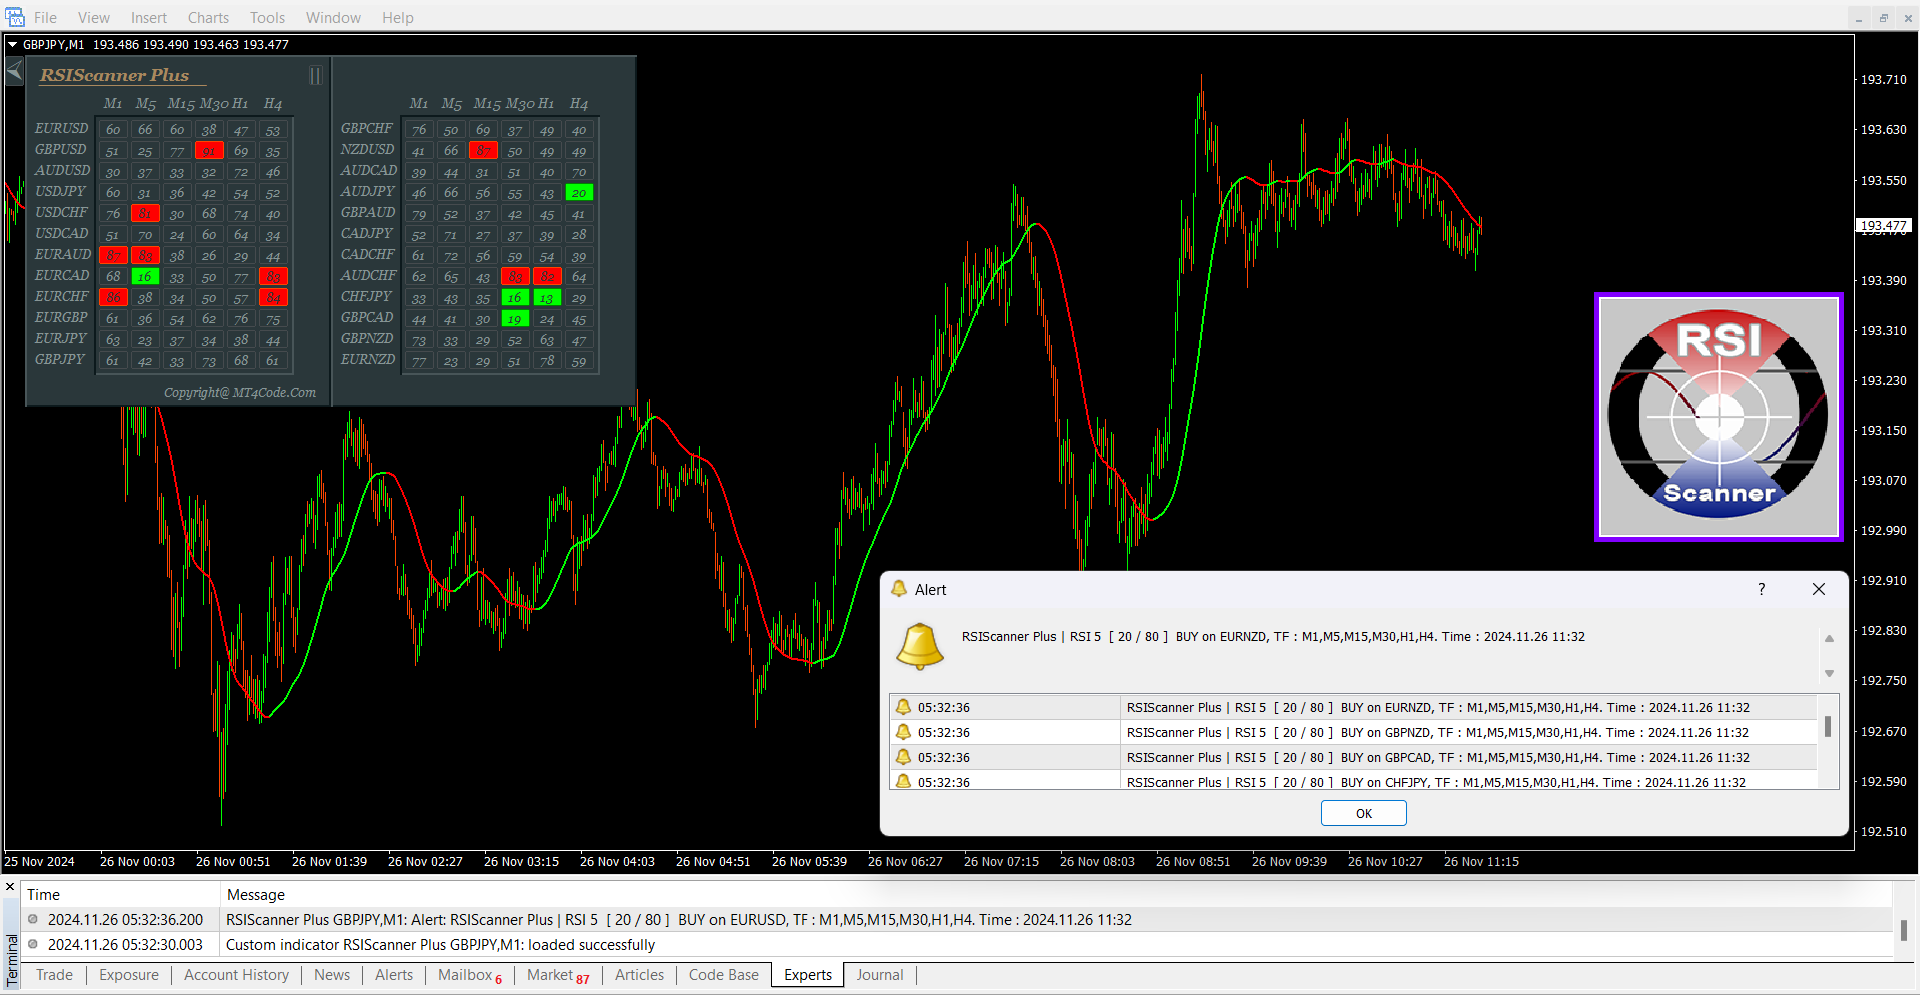
Trend Line on Chart:
A trend line is drawn on the chart to help you visualize the current market trend.
The trend line complements the RSI values by indicating whether the market is in an uptrend or downtrend.
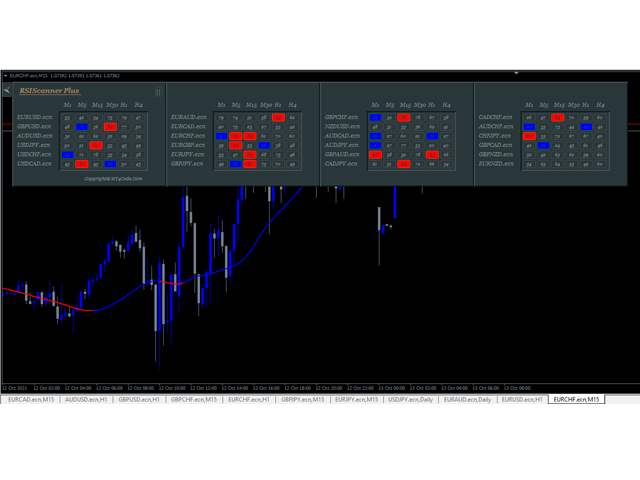
Changeable Panel Display:
You can customize the number of symbols and panels to display according to your preferences, with the dashboard adjusting to fit your input.
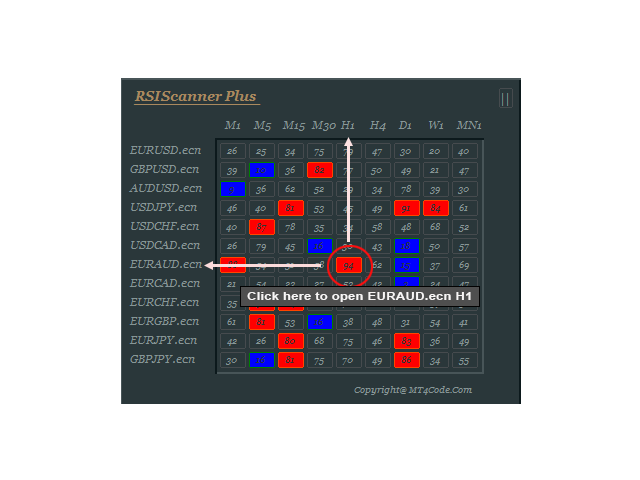
Clickable Boxes:
Each box in the dashboard is clickable, allowing you to instantly open the corresponding symbol and timeframe on the chart.
Hide/Show Dashboard:
You can easily toggle the visibility of the dashboard on the chart to avoid cluttering your screen while analyzing other indicators.
Customizable Colors:
The colors of the boxes and trend lines are customizable. For example:
Blue Box = Oversold
Red Box = Overbought
Blue Trend Line = Uptrend
Red Trend Line = Downtrend
RSI Values Display:
The indicator shows the RSI values for each symbol and timeframe, helping you monitor overbought and oversold conditions.
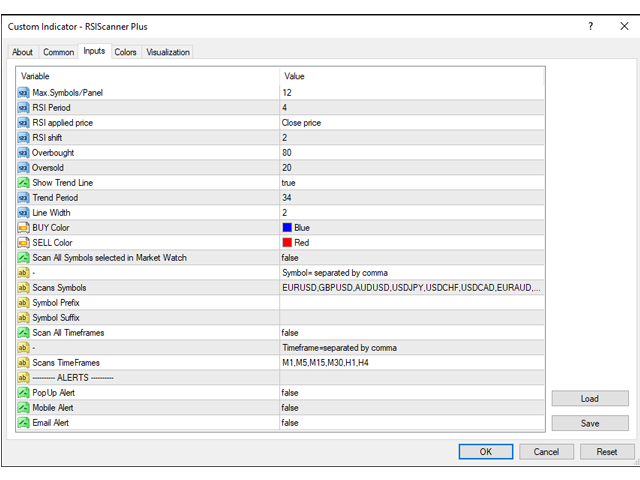
Parameter Settings:
Max.Symbols/Panel: Number of symbols to display in the panel.
RSI Period: The RSI period (default is 4).
RSI Applied Price: Choose the RSI applied price (default is PRICE CLOSE).
RSI Shift: Set the RSI shift for scanning.
Overbought: The RSI value considered overbought.
Oversold: The RSI value considered oversold.
Show Trend Line: Option to show or hide the trend line.
Trend Period: Set the period for calculating the trend.
Line Width: Set the width of the trend line.
BUY Color: Customize the color of the uptrend line and oversold boxes.
SELL Color: Customize the color of the downtrend line and overbought boxes.
Scan All Symbols in Market Watch: If enabled, the indicator will scan all symbols in your market watch list.
Scans Symbols: Manually specify which symbols to scan.
Symbol Prefix/Suffix: Add prefix or suffix for symbols (e.g., EURUSD.ecn).
Scan All Timeframes: If enabled, it will scan all timeframes (M1 to Monthly).
Scans Timeframes: Manually specify which timeframes to scan.
Minimum Total TFs to Alert/Symbol: Set the minimum number of timeframes in which the price must be overbought or oversold to trigger an alert.
PopUp Alert: Enable or disable pop-up alerts on the chart.
Mobile Alert: Enable or disable mobile alerts on MT4.
Email Alert: Enable or disable email alerts for overbought/oversold conditions.
Trading Strategies Using RSI Scanner Plus:
Higher Trend Lower RSI Strategy:
Concept: Follow the higher timeframe trend (e.g., H1), and look for oversold/overbought conditions on lower or same timeframes (e.g., H1, M30, M15).
Entry: Enter a buy when the price is oversold and the trend is up. Enter a sell when the price is overbought and the trend is down.
Stop Loss and Take Profit: Place your stop loss below the recent price low (for buys) or above the recent price high (for sells), and set the take profit 1 to 2 times the stop loss distance.
All Over Strategy:
Concept: Enter a trade when at least 3 timeframes are showing overbought or oversold conditions.
Entry: For example, if M1, M5, and M15 are all oversold, enter a buy order.
How RSI Scanner Plus Can Help Your Trading:
Whether you are already familiar with trading strategies based on the RSI or are looking to implement a new one, the RSI Scanner Plus provides valuable insights that will help you make more informed trading decisions. The real-time RSI data from multiple timeframes, combined with trend lines and customizable alerts, empowers you to track the market efficiently.