


INSTANT DOWNLOAD!
Original price: $719.88 per/year
Our price: $24.00
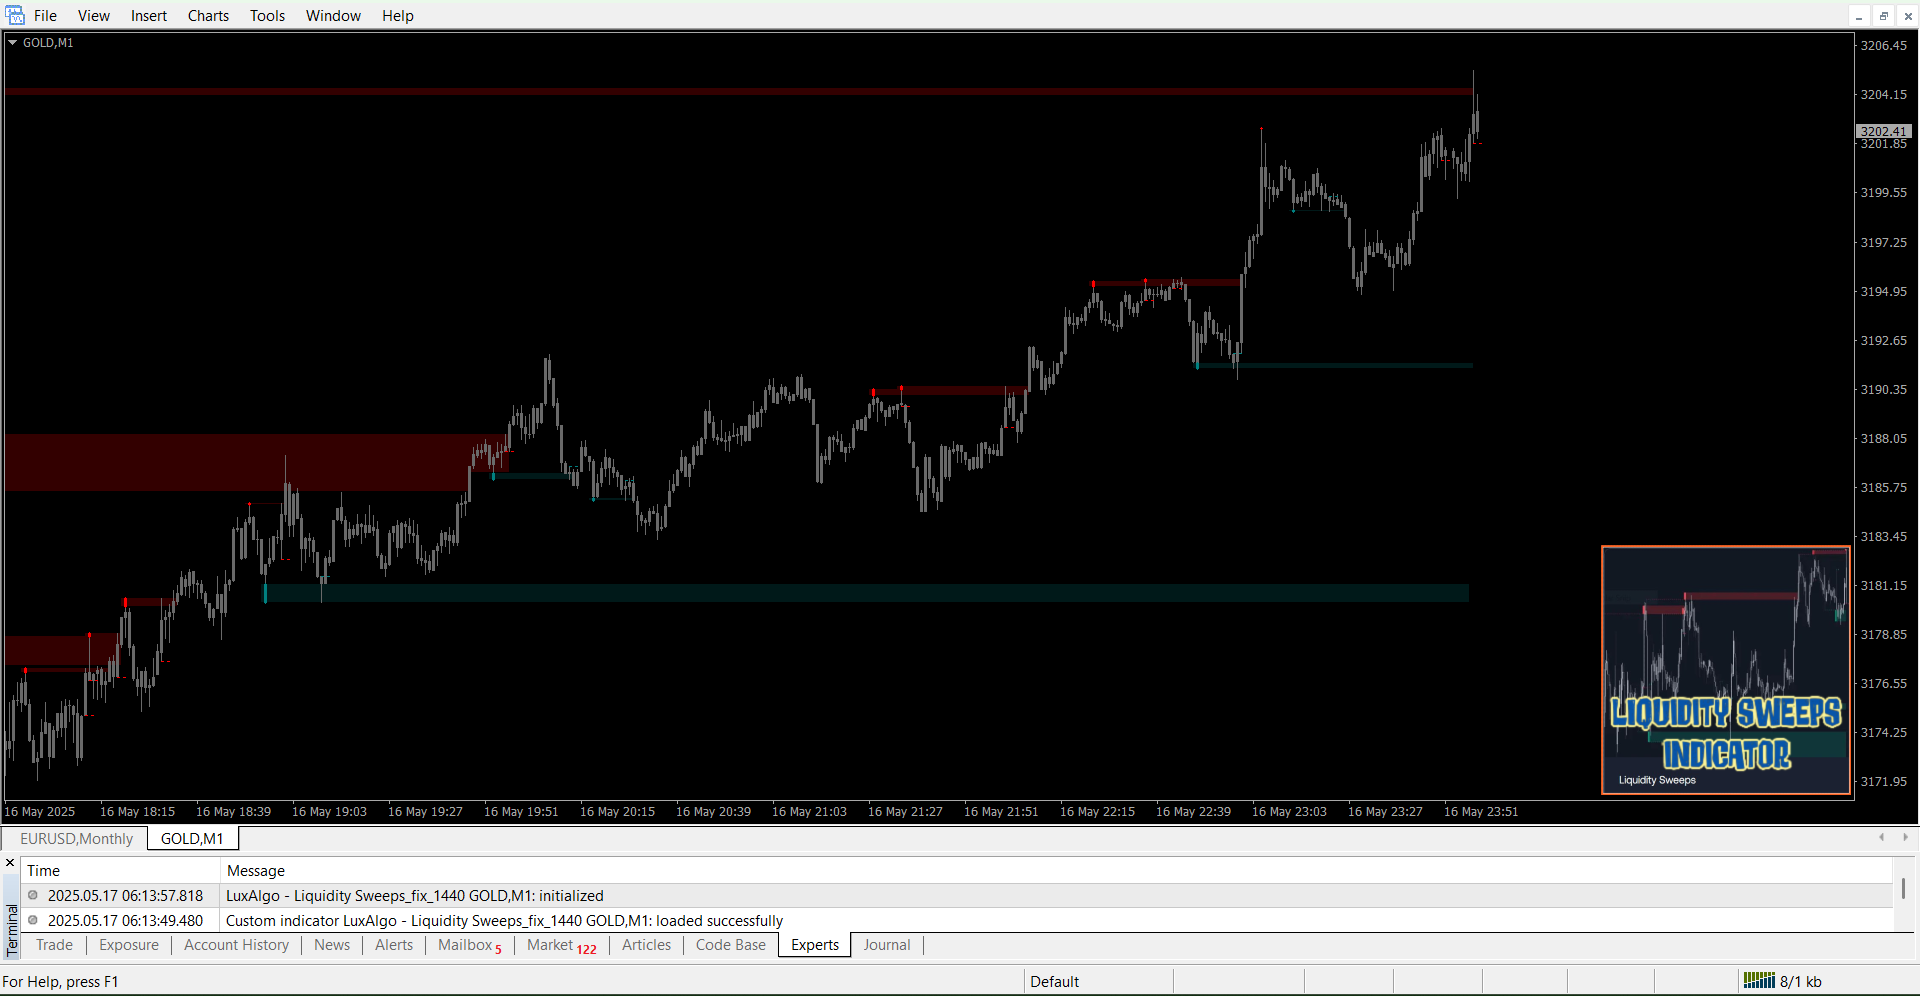
Indicator: LuxAlgo – Liquidity Sweeps_fix_1440.ex4 (Unlocked MT4 Build 1440+), NO MANUAL.
Liquidity Sweeps Indicator: Spot Key Market Moves with Confidence
The Liquidity Sweeps indicator is designed to help traders pinpoint important liquidity sweeps directly on their charts. By highlighting crucial areas of support, resistance, or entry points when Liquidity Levels (LqL) are breached, this tool becomes invaluable for traders seeking to understand market dynamics better.
A liquidity sweep happens when the price briefly breaks through a liquidity level (LqL) but quickly reverses, leaving behind a prominent wick. This behavior signals potential market traps or shifts, and the indicator visually marks these moments to give traders actionable insights.
How to Trade Using the Liquidity Sweeps Indicator
Liquidity sweeps occur through dynamic price action around LqLs, typically in two main ways:
Wick Breakout: The wick extends beyond a liquidity level (LqL) before the price sharply pulls back, indicating a false breakout or liquidity grab.
Close & Retest: The closing price moves past an LqL, and the market then retests this level, forming a wick in the opposite direction — often signaling a potential reversal.
By recognizing these patterns, traders can make more informed decisions about entry and exit points.

In the illustrated examples, you can see both bullish and bearish cases where the wick penetrates a Liquidity Level (LqL) and then quickly pulls back. This movement is represented by a dotted line, indicating a specific type of Liquidity Sweep.
Another scenario shows a broken LqL where the price tests the liquidity zone and then bounces off. These types of liquidity sweeps are displayed using a dashed line on the chart.
During a liquidity sweep, the indicator highlights the distance between the wick and the Liquidity Level (LqL). This measurement is crucial for identifying potential support or resistance zones, known as the Sweep Area, where traders can look for possible entry points.
Traders can customize the indicator’s colors in the settings to enhance visibility, with popular choices including yellow and aqua blue.
Identifying Sweep Areas
Sweep Areas are clearly marked zones created by the distance between the Liquidity Level (LqL) and the wick’s highest point. These areas often signal important support or resistance levels and highlight potential entry opportunities for traders.
The examples highlight both types of Liquidity Sweeps, with a boxed Sweep Area providing a clear visual reference. Once a Sweep Area is fully tested or the specified number of bars (adjustable via the Max bars setting) has passed, the zone stops updating and is no longer displayed.
The Trigger label marks the point where the price’s high crosses a Liquidity Level (LqL), highlighted by a red box that spans from the LqL to the high. The low of this bar starts a dotted line, which helps identify potential entry or resistance levels. In the bars that follow, traders may find short-entry opportunities, especially if the price breaks below this dotted line.
On the bullish side, entry signals appear after LqL sweeps, marked by the formation of Sweep Areas.
The green dotted lines assist traders in spotting when the price breaks above a level, creating a brief consolidation before continuing its upward movement.
An initial trigger creates a Sweep Area that is quickly breached. However, the green line signals potential entry zones that follow. The price moves within a tight channel before breaking above the Liquidity Level (LqL), shown as a green dashed line, opening up new entry opportunities. Later, the market revisits the LqL, adjusts, and stays within the channel, setting the stage for another upward move.
Configuration and Adjustments
Liquidity Sweeps
Swings: Sets the period for swing detection. Increasing this value helps spot longer-term Liquidity Levels.
Options:
Only Wicks: Detects liquidity sweeps only when a wick surpasses a previous wick.
Only Outbreaks & Retest: Detects sweeps when the closing price breaks a liquidity level, retests it, and forms a wick in the opposite direction.
Wicks + Outbreaks & Retest: Detects both conditions simultaneously.
Sweep Area
Extend: Enable or disable extending the Sweep Area boxes.
Max Bars: Limits how many bars the Sweep Area boxes can be extended.
Color Sweep Area Box: Customize the color of the Sweep Area boxes for better visibility.