
Crash-Proof EA Templates You Can Use in 2026
Automated trading carries risks, but crash-proof EA templates protect capital and limit losses. These templates...


Mastering Forex trading requires understanding the tools that can help you make informed decisions—and Forex indicators are among the most essential. From trend detection to precise entry and exit points, indicators serve as a compass in the fast-moving Forex market. Whether you’re a beginner learning the ropes or an experienced trader refining your strategy, using Forex indicators effectively can dramatically improve your market analysis and performance.
In this comprehensive guide, we’ll walk you through everything you need to know about Forex indicators, from the basics to advanced strategies. We’ll also highlight some of the top tools, platforms, and products to help you become a more confident trader.
Explore this in-depth article powered by GregForex.com, your one-stop hub for expert insights, trusted trading tools, and Forex indicator bundles. For a broader look at must-have tools, check out our guide on the Best Tools for Forex Trading.
Forex indicators are mathematical calculations based on price, volume, or open interest of a currency pair. They provide signals to help traders determine when to enter or exit a trade. Most indicators are used in technical analysis and serve to simplify raw data, making it easier to identify patterns and potential trading opportunities.
The primary role of Forex indicators is to give traders a systematic approach to analyzing the market. By using indicators, traders reduce emotional decision-making and base their trades on quantifiable data. This method helps improve consistency and risk management.
Check our blog post How to manage risk in forex trading for more insights.
Forex indicators fall into two main categories:
Both types of indicators have their strengths, and many traders combine them to create a balanced strategy.
Forex indicators are designed to help traders predict where the market might go next. For example, a rising RSI might suggest that a currency pair is overbought and due for a correction. Indicators like Bollinger Bands can signal volatility, hinting at potential price breakouts.
While no indicator can predict the future with 100% accuracy, using a combination of indicators can provide high-probability setups, especially when they align with broader market conditions.
One of the biggest challenges in Forex trading is knowing when to get in and out of a trade. Indicators provide clear visual cues to help make these decisions. For instance, a crossover of the MACD line can signal a potential trend reversal, while Fibonacci retracement levels can help set exit targets.
Using indicators to refine your entry and exit points can significantly improve your trading accuracy and reduce losses.
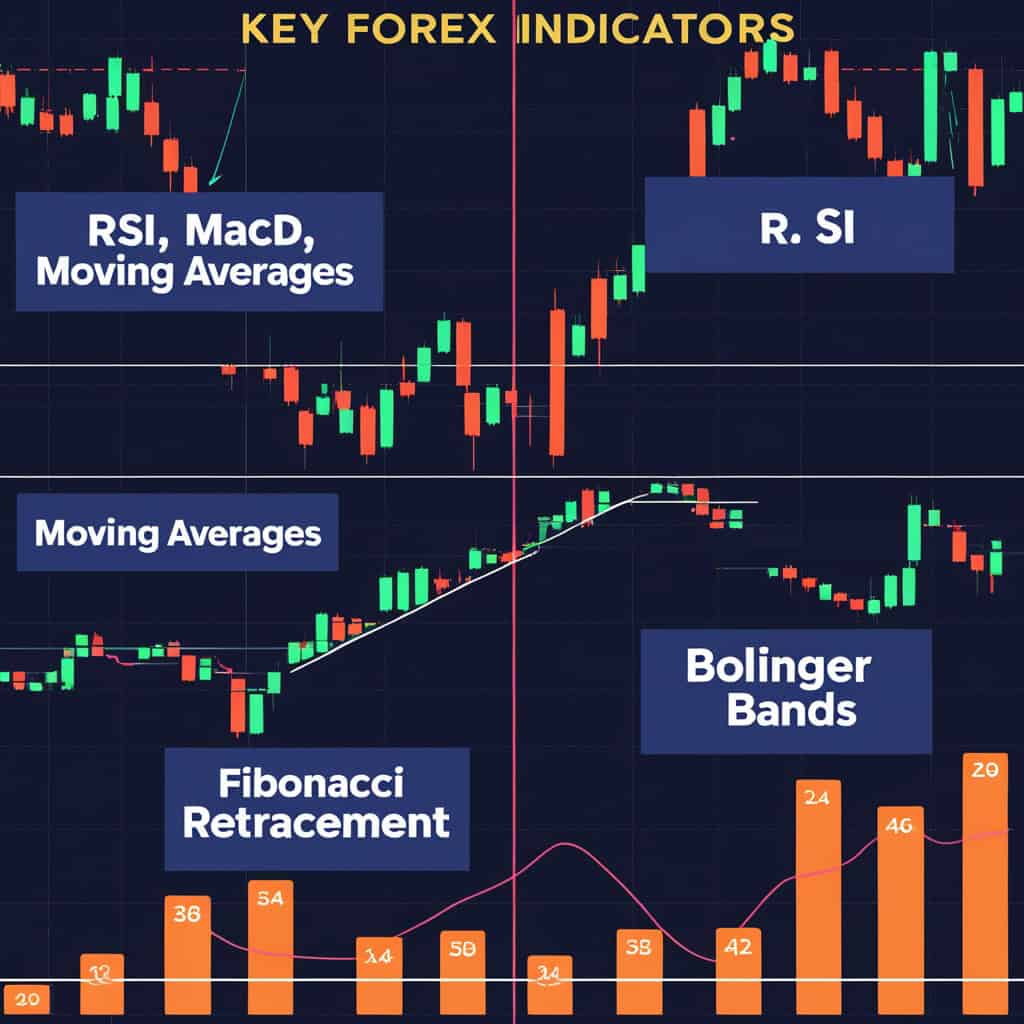
Moving Averages smooth out price data to reveal trends over time. They are easy to use and effective for identifying trend directions. Common types include:
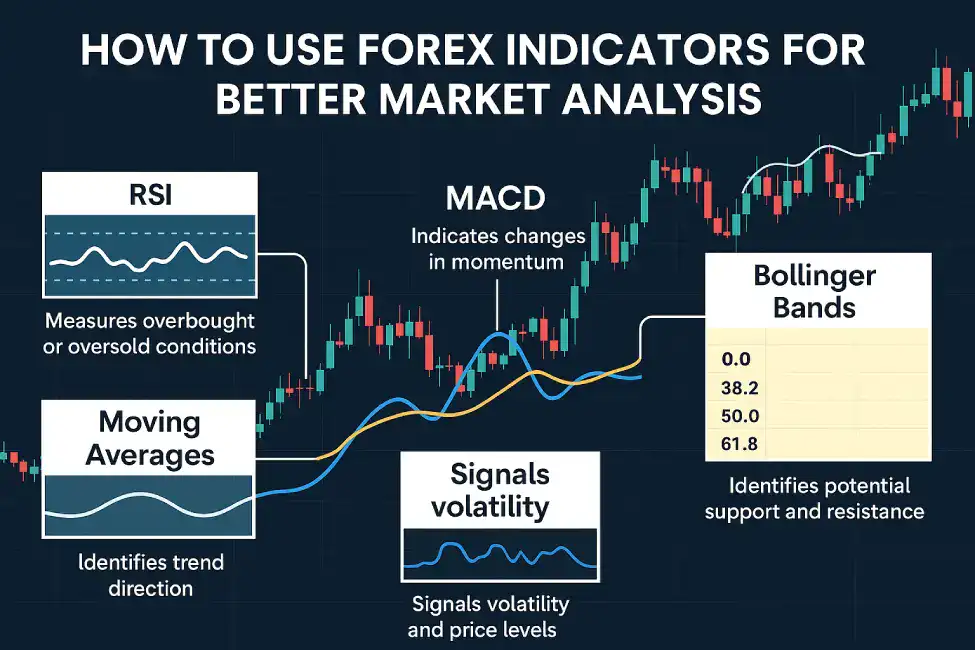
The RSI measures the magnitude of recent price changes to evaluate overbought or oversold conditions. An RSI above 70 suggests a pair is overbought; below 30 suggests it’s oversold. RSI is particularly useful for momentum-based strategies.
MACD shows the relationship between two EMAs and includes a signal line to identify buy and sell signals. A MACD crossover, when the MACD line crosses above or below the signal line, is a popular trigger among traders.
Bollinger Bands consist of a middle band (SMA) and two outer bands that measure volatility. When prices break above or below the bands, it signals potential overbought or oversold conditions.
Fibonacci retracement levels are used to identify potential reversal zones based on the Fibonacci sequence. Key levels include 38.2%, 50%, and 61.8%, which often align with support and resistance levels.
This momentum indicator compares a particular closing price to a range of prices over a set period. Readings above 80 indicate overbought conditions, while below 20 indicates oversold.
To increase the accuracy of your signals, it’s often wise to combine two or more indicators. For example, use a trend indicator like EMA along with a momentum indicator like RSI. This helps confirm the validity of signals.
Avoid using indicators that provide the same type of data, as this can create redundancy. Instead, use a mix of leading and lagging indicators for better balance.
Use a 50-day MA to determine the trend direction and the RSI to identify potential overbought or oversold levels. This combination offers both trend-following and momentum insights.
Use MACD divergence to spot potential reversals, and apply Fibonacci retracement levels to time entries and exits around support/resistance zones.
A common mistake among traders is overloading their charts with indicators. Keep it simple. Use only the indicators that add real value to your decision-making.
Before going live, backtest your strategy using platforms like MetaTrader 5 or TradingView. Backtesting helps you understand how your strategy performs over historical data.
Some indicators work better in trending markets (e.g., Moving Averages), while others excel in ranging conditions (e.g., RSI). Adjust your strategy based on the current market context.
No single indicator is foolproof. Relying solely on one can lead to inaccurate predictions and poor trades. Instead, build a strategy that uses multiple confirming indicators.
While technical indicators are powerful, they should not be used in isolation. Economic news, interest rate decisions, and geopolitical events can override technical setups. Stay informed with sites like Forex Factory.
Indicators should be part of a well-defined trading plan that includes entry/exit rules, risk management, and position sizing. Check our blog post Why You Need a Trading Plan for more insights.
This duo is ideal for short-term trades. RSI highlights overbought/oversold conditions, while MACD confirms the trend direction.
Combine the speed of EMA with the volatility tracking of Bollinger Bands to catch breakouts and price surges.
SMA is great for identifying long-term trends. It’s easy to understand and forms the basis for more advanced indicators.
With clear thresholds (30/70), RSI is intuitive and excellent for beginners. Use it to avoid chasing trades and time your entries more effectively.
Explore our Starter Indicator Kit designed specifically for new traders.
Ichimoku offers a comprehensive view of support, resistance, momentum, and trend direction. It may seem complex at first, but it’s incredibly powerful when mastered.
Volume indicators help verify the strength behind price moves. When price and volume rise together, the move is more likely to sustain. Learn more in our blog: How Volume Confirms Price Action.
MetaTrader platforms offer robust tools for indicator-based trading, including automated strategies (EAs). You can access our expert tools on MetaTrader 5.
This web-based platform offers high-quality charts, community indicators, and backtesting capabilities. It’s perfect for traders who want flexibility and speed.
This news and analysis site complements technical trading by offering real-time updates on fundamental events.
Forex indicators are essential tools that every trader should understand and use wisely. From basic tools like SMA and RSI to complex strategies involving Ichimoku and MACD, mastering these indicators can give you a competitive edge in the market.
Just remember: indicators are tools, not guarantees. Always use them within the context of a solid trading plan and never ignore the bigger picture, including market sentiment and economic news.
Ready to elevate your trading journey? Visit GregForex.com to browse our curated Forex tools, advanced strategies, and best-selling products like the Ultimate Forex Indicator Bundle or MACD Pro Signal Scanner. Trade smarter, not harder.
Automated trading carries risks, but crash-proof EA templates protect capital and limit losses. These templates...
Understanding major and minor currency pairs is the first step in forex trading. Understanding major...