


INSTANT DOWNLOAD!
Original price: $1,999.00
Our price: $99.00 95% OFF Retail!
Indicators: #System2_MainTrend.ex4, #System2_SubTrend.ex4, #VolumeBars.ex4, Watermark.ex4, Template: # Chart Intelligence System2.tpl, UserGuide: System No.2 User Manual.pdf.
MT4 Compatible — Seamless Integration
Install with just one click and effortlessly integrate the system into your MetaTrader 4 platform. No complicated setup required — start trading smarter, faster.
Buy or Sell? — Trade Direction Made Crystal Clear
Our intelligent step-chart histogram combined with a powerful cycle analyzer removes all guesswork. The system clearly signals trade direction, so you never wonder whether to buy or sell.
Low Risk, High Reward — Smart Money Management
Custom-designed money management rules are built in to boost your performance while protecting your hard-earned profits. Maximize gains and minimize risks automatically.
The Challenge
We were tasked with developing a professional “high-volume zone” style MT4 trading system tailored for both trend followers and swing traders. The system had to deliver a strong risk/reward ratio, feature a unique Volume Spread Analysis (VSA) volume bar base chart, and visually present trend direction and important market cycles.
The Solution: System No.2
System No.2 was engineered to meet the needs of sophisticated traders who combine swing trading with trend-following strategies. Key features include:
A two-component step histogram that clearly displays trend direction and market cycles.
A custom multi-color volume bar base chart for advanced VSA visualization, giving you deeper insight into market activity.
An innovative market cycle indicator that visually represents trend cycles, helping you time entries and exits more precisely.
Trade confidently with a system designed for clarity, precision, and powerful risk/reward performance.
The Results Are Excellent
The true power of System No. 2 lies in its smart high-volume zone indicator. With the custom six-color VSA bar charts and intuitive binary trend cycle analyzers, determining market direction has never been easier or more precise.
The Rules of the System
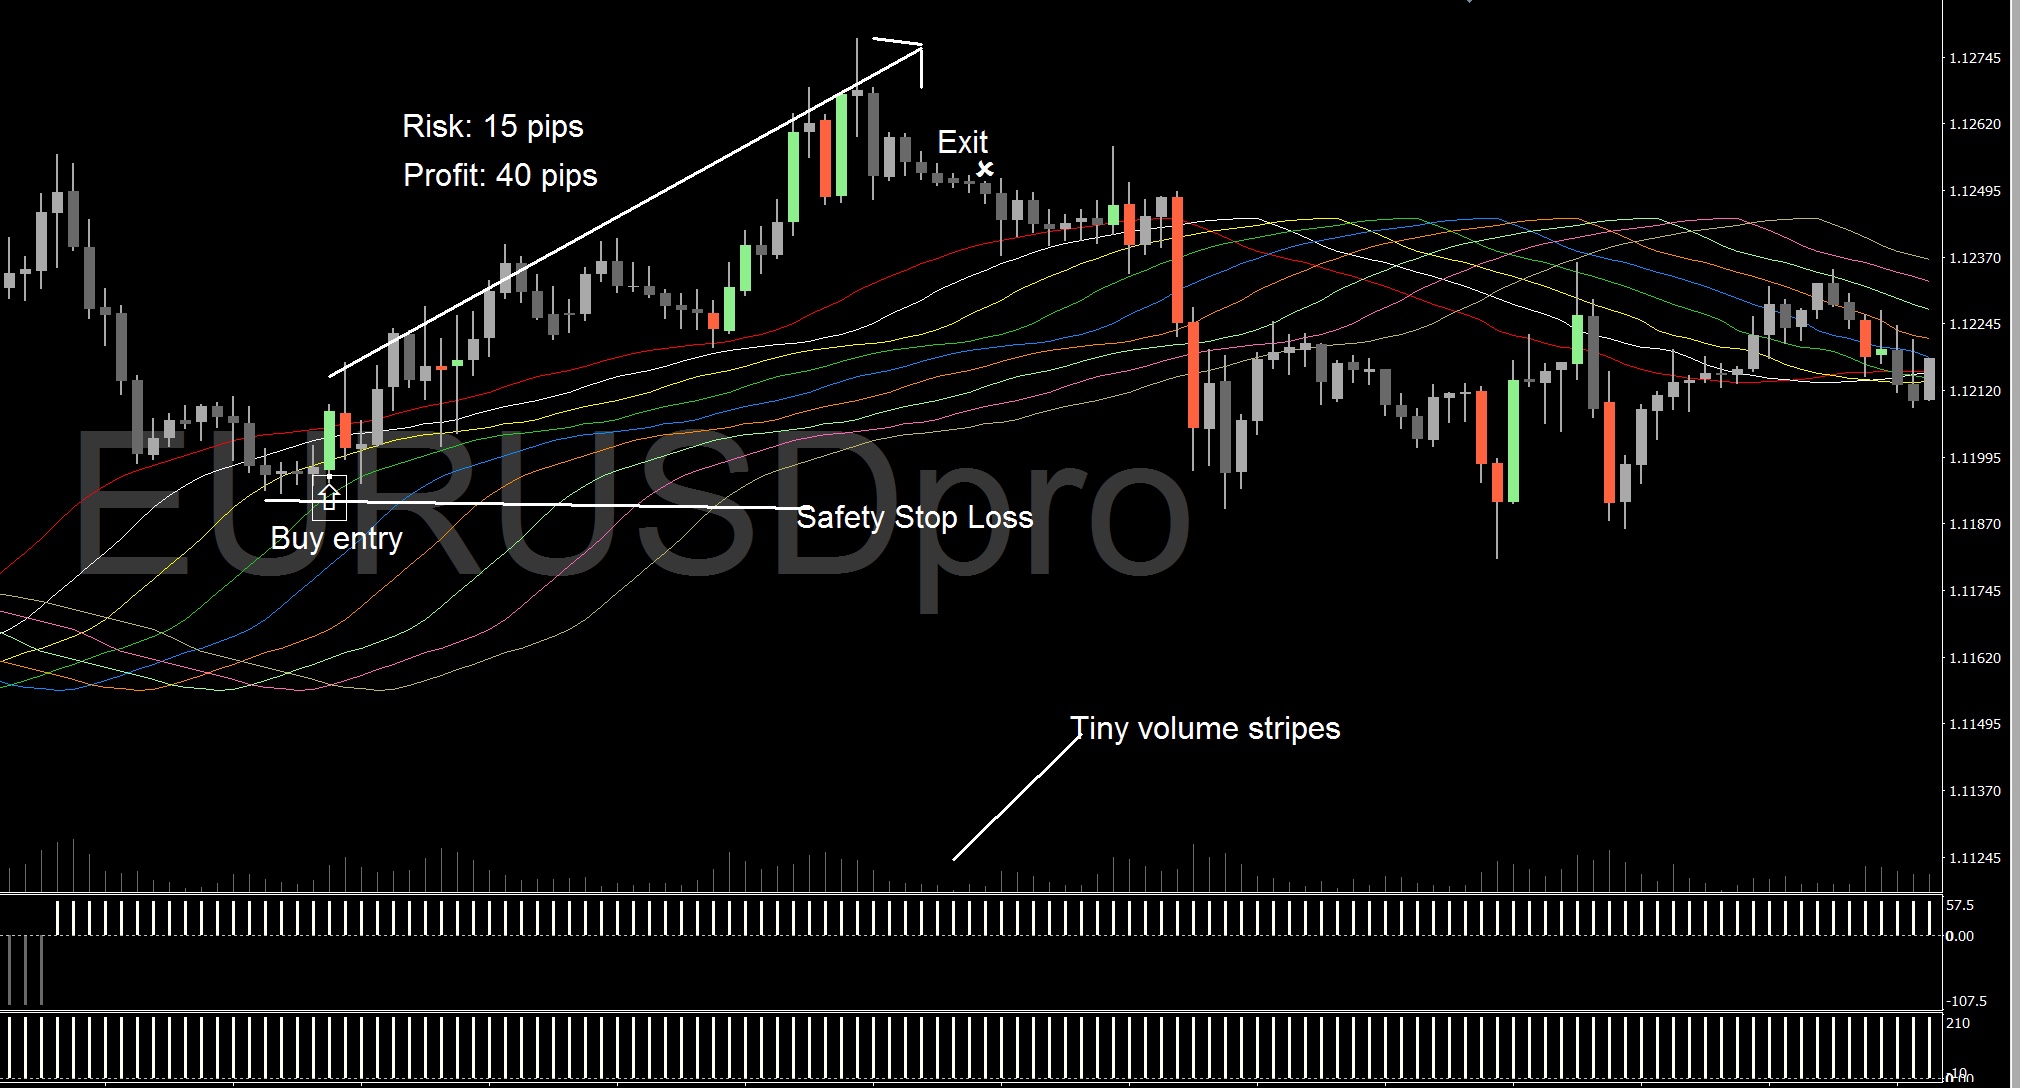
Buy Entry Rules:
Price is above the Trend Ribbon.
The MainTrend histogram shows a bullish (light) color.
The SubTrend histogram is also bullish (light) color.
A green TrendBar appears on the chart.
(Secondary confirmation) The VolumeMeter stripe for the entry bar is longer than the previous bar.
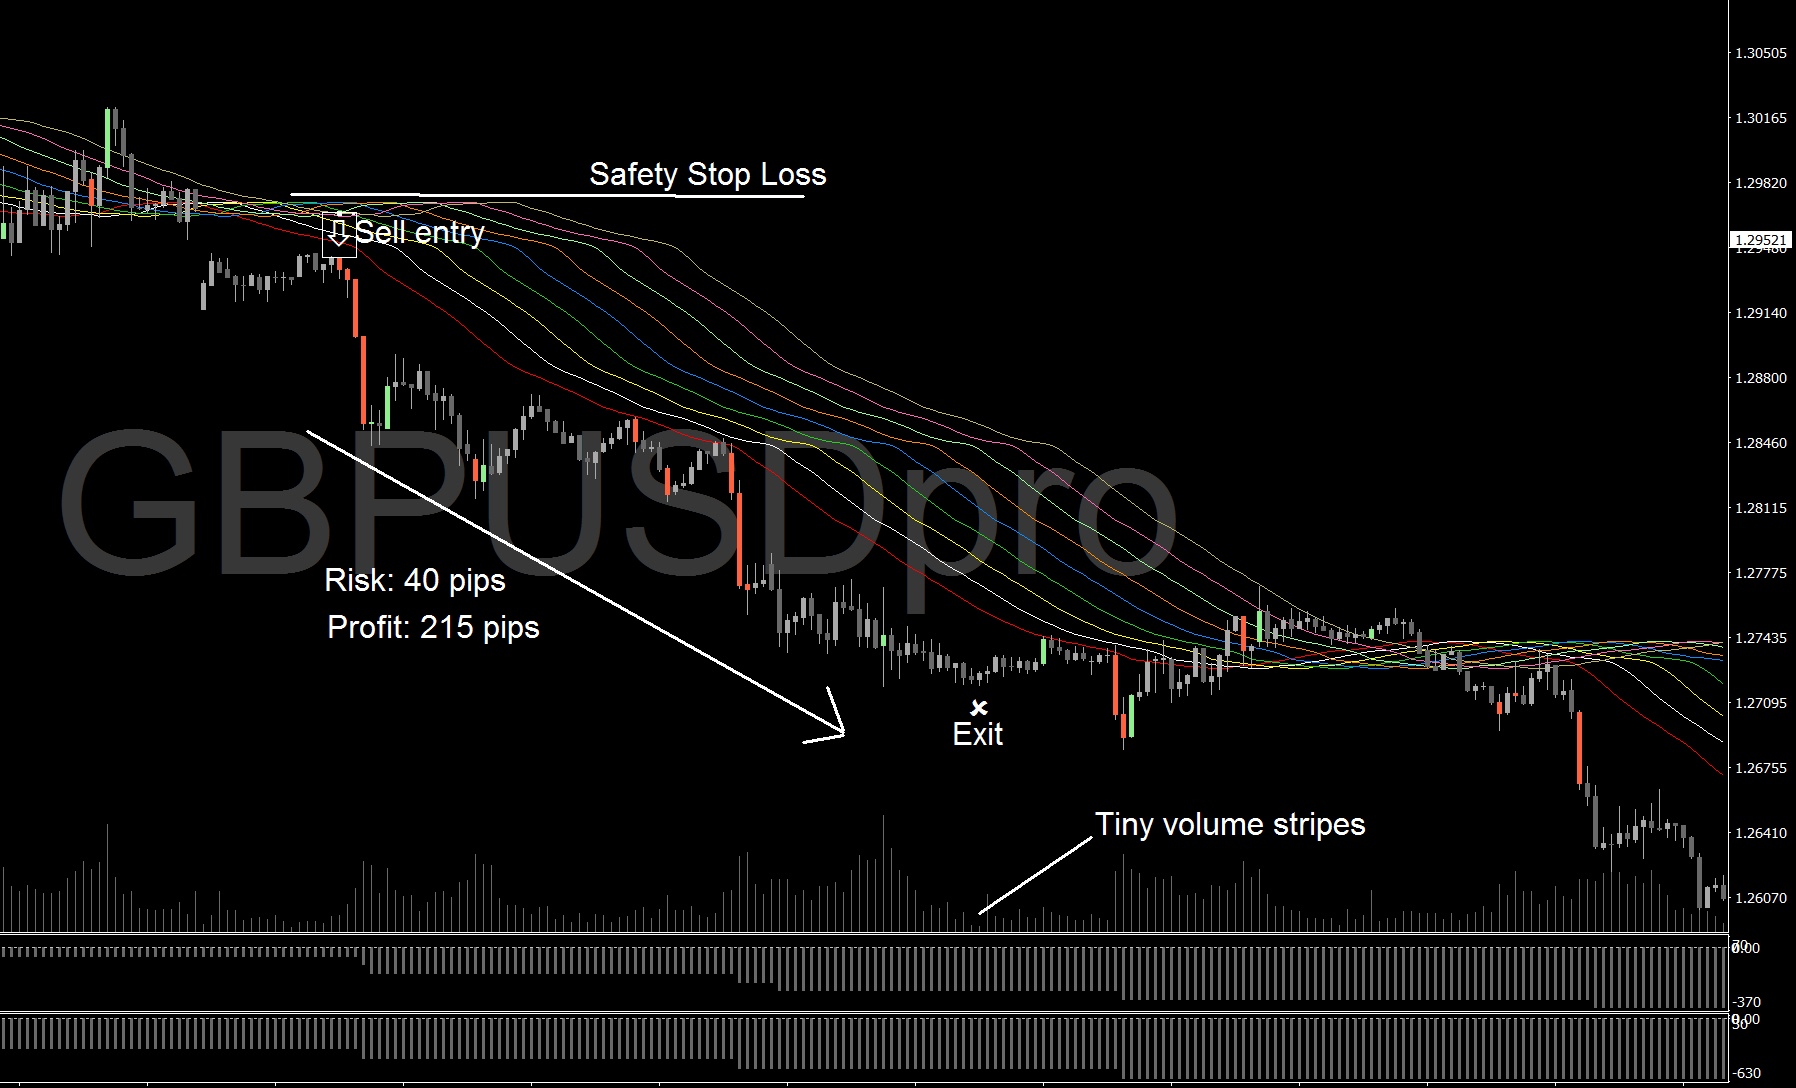
Sell Entry Rules:
Price is below the Trend Ribbon.
The MainTrend histogram shows a bearish (dark) color.
The SubTrend histogram is also bearish (dark) color.
A red TrendBar appears on the chart.
(Secondary confirmation) The VolumeMeter stripe for the entry bar is longer than the previous bar.
Safety Stop Loss
Place your safety stop loss at the last significant high or low.
Exit Rules
Choose the exit rule that best fits your trading style and money management approach:
Fixed Risk-Reward: Exit with a Stop Loss : Take Profit ratio of 1:1 (e.g., if SL is 40 pips, TP should be 40 pips) — ideal for automated trading.
Volume-Based Exit: Exit when the volume weakens, indicated by tiny stripes on the VolumeMeter.
Round Number Exit: Exit near the nearest round number level (e.g., 1.2200, 1.4600).
Additional Tips
You can re-enter trades each time the TrendBars confirm a signal and your entry confirmation tools align.
Use Fibonacci lines for setting targets or stop loss zones.
The system performs best on M30, H1, and H4 charts but can be adapted to smaller timeframes with a more cautious risk approach. Experiment to find your favorite timeframes and currency pairs.
If the Rainbow trend ribbon becomes very thin and the lines cross like a grid, it signals a ranging market — avoid entering trades during these periods as the trend is unclear.
Why Choose System No. 2?
This innovative system blends volume trading, step-chart histograms, and trend cycle analysis into one powerful and user-friendly trading tool. Its unique design delivers excellent results and is highly recommended for traders looking to combine swing trading and trend-following strategies.