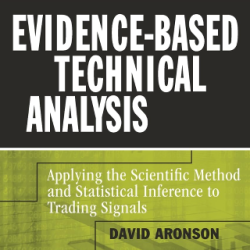
Evidence Based Technical Analysis
$110.00 Original price was: $110.00.$22.00Current price is: $22.00.

It works like a magic!
As a trader, I found this tool useful for spotting market trends and making informed decisions. The real-time data and clear chart patterns help identify potential trade opportunities.
Christina K

Verified Purchase
INSTANT DOWNLOAD!
Original price: $110.00
Our price: $22.00 80% OFF Retail!
Evidence-Based Technical Analysis.pdf.


🎯 Core Message
Aronson’s book is a rigorous, data-driven dismantling of subjective technical analysis (TA), emphasizing that most TA fails to hold up under objective, statistically sound scrutiny. He firmly aligns with the scientific, statistical viewpoint, offering not just critiques, but a framework for properly testing trading rules.
⚔️ Two Audiences, Two Reactions
-
Statisticians: Will feel validated. The book echoes long-held skepticism toward traditional TA and offers a methodical takedown using logic, statistical tools, and evidence.
-
Technical Analysts (Technicians): Will likely be challenged or frustrated. Aronson critiques the very foundations of chart-based TA, implying that most of it lacks empirical support and is based on illusion.
🧠 Key Themes
-
Subjective TA ≠ Science: Visual chart patterns and loosely defined rules often produce “illusory patterns” due to human biases and randomness.
-
Objective Rules Must Be Testable: Aronson insists on falsifiability—rules must be hard-coded and tested statistically, not just applied based on gut or visuals.
-
Data Mining Is Dangerous: Without controlling for data-mining bias, most backtested strategies are just flukes. The book introduces Monte Carlo simulation as a better method to evaluate robustness.
-
No Free Lunch: Even after testing 6,402 rules, none provided statistically significant alpha, reinforcing the Efficient Market Hypothesis (EMH) in the long term.
📚 Structure Summary
The book is divided into four parts:
-
Objective Rule Construction
Concepts like benchmarking, trigger thresholds, and why backtest results alone are insufficient. -
Debunking Subjective TA
Strong critique of pattern-based analysis. Advocates replacing intuition with evidence. -
Statistical Foundations & Bias
Explains hypothesis testing, confidence intervals, and dangers of overfitting. Introduces Monte Carlo testing. -
Real-World Case Study
Applies the proposed framework to S&P 500 data. Results: none of the TA rules passed statistical muster.
📌 The Bottom Line
Aronson is not saying TA can never work—only that most of it doesn’t when subjected to scientific testing. He leaves room for profitable strategies that are:
-
Short-term
-
Complex
-
Adaptive
-
Statistically validated
This book is not for casual readers. It demands statistical literacy and a willingness to challenge cherished beliefs. For serious traders and system developers, however, it’s a seminal work—liberating, rigorous, and a must-read for evolving beyond “chartist” dogma.
💬 Favorite Analogy from the Review
“Aronson’s book reminds me of that masked magician on TV who has given away the secrets to all the best stage illusions.”
That’s exactly what this book does—reveals the statistical sleight-of-hand behind much of TA and pushes readers toward evidence-based trading.


