


It works like a magic!
As a trader, I found this tool useful for spotting market trends and making informed decisions. The real-time data and clear chart patterns help identify potential trade opportunities.
INSTANT DOWNLOAD!
Your price: $9.00
Content: Indicator: PTS_SuppRes_MTF Unlimit.ex4 v1.2 (Unlocked-Unlimited), NO MANUAL.

Support/Resistance MTF Indicator: Your Key to High-Probability Reversal Setups
With the Support/Resistance MTF Indicator, you can easily detect high-probability reversal setups in the market.
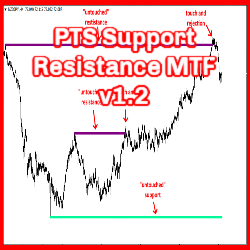
One of its key features is identifying “untouched” support and resistance price levels, which are crucial in spotting my preferred setup type: Golden Setups. These untouched price levels are often powerful markers in the market, as they tend to produce sharp reversals when price reaches them.
By utilizing this indicator, you’ll be able to identify these critical levels, giving you an edge in making informed trading decisions and capitalizing on high-probability reversals.

Additional Benefits of the Support/Resistance MTF Indicator:
-
Detects Support/Resistance from Higher Timeframes: This feature enhances the reliability of the support and resistance levels by incorporating higher timeframe data. Higher timeframes often provide stronger, more significant price levels that are more likely to influence market behavior.
-
Configurable Detection of Support/Resistance: You have full control over how the indicator detects support and resistance. This allows you to tailor the detection process to match your trading strategy and preferences, ensuring more accurate and personalized results.
The following screenshot illustrates how the untouched support and resistance price levels are drawn, demonstrating how price typically reacts when it reaches these levels. These price levels act as critical turning points for potential market reversals, giving you a better understanding of where to enter or exit trades for optimal risk/reward outcomes.


Additional Information Advantage with the Support/Resistance MTF Indicator:
While you’re analyzing lower time frames such as M30/H1 for entry opportunities, this indicator provides you with a significant edge by displaying major support and resistance levels from higher time frames, like the weekly time frame.
By having these key levels visible on your chart, you can make more informed decisions. It helps you avoid entering trades near strong support or resistance zones that might lead to a reversal. This added context allows you to align your lower timeframe entries with broader market trends, enhancing the probability of successful trades.
In essence, this feature gives you a clearer picture of market structure and potential price reactions, ultimately improving your trading strategy.
