
It works like a magic!
As a trader, I found this tool useful for spotting market trends and making informed decisions. The real-time data and clear chart patterns help identify potential trade opportunities.
INSTANT DOWNLOAD!
Your price: $15.00
Content: Indicator: RSIScanner Plus.ex4 v1.4 (Unlocked-Unlimited), UserGuide: RSIScanner Plus v1.4.pdf.
RSI Scanner Plus Indicator Overview
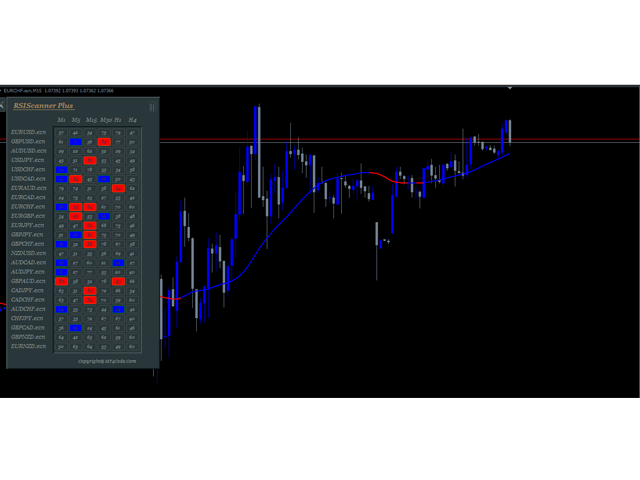
The RSI Scanner Plus Indicator is a versatile tool designed to enhance your trading by scanning multiple symbols and timeframes for RSI values. It not only provides real-time RSI data but also displays trend lines on the chart, helping you make informed trading decisions.
Key Features:
-
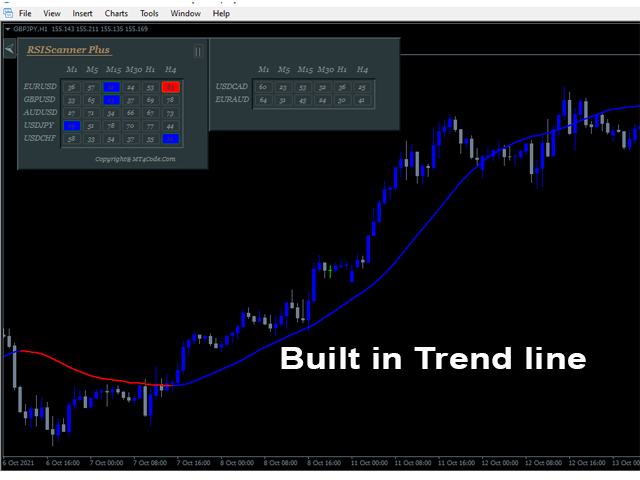
Trend Line on Chart:
-
A trend line is drawn on the chart to help you visualize the current market trend.
-
The trend line complements the RSI values by indicating whether the market is in an uptrend or downtrend.
-
-
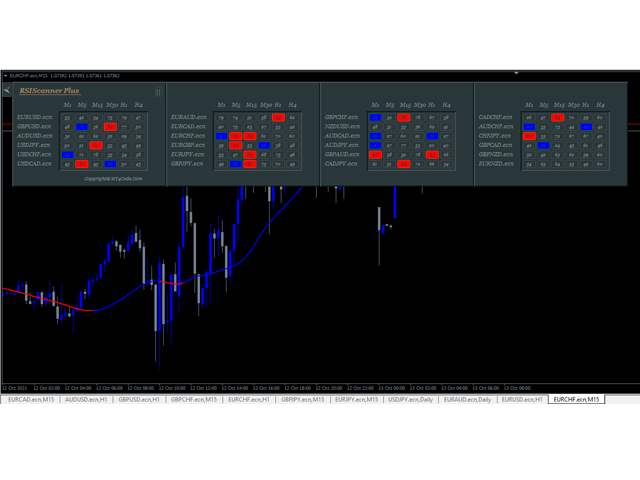
Changeable Panel Display:
-
You can customize the number of symbols and panels to display according to your preferences, with the dashboard adjusting to fit your input.
-
-
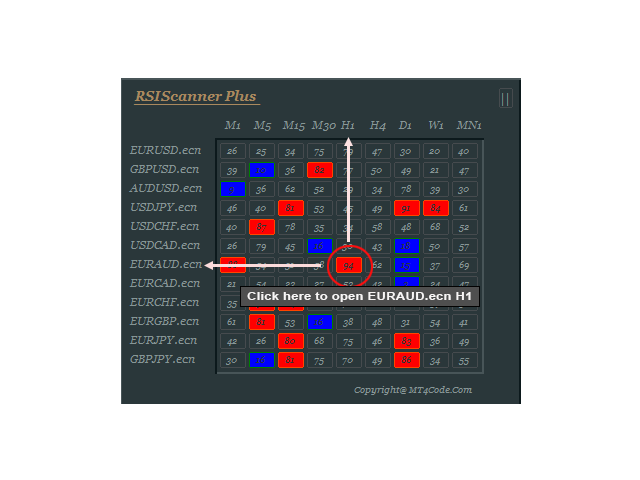
Clickable Boxes:
-
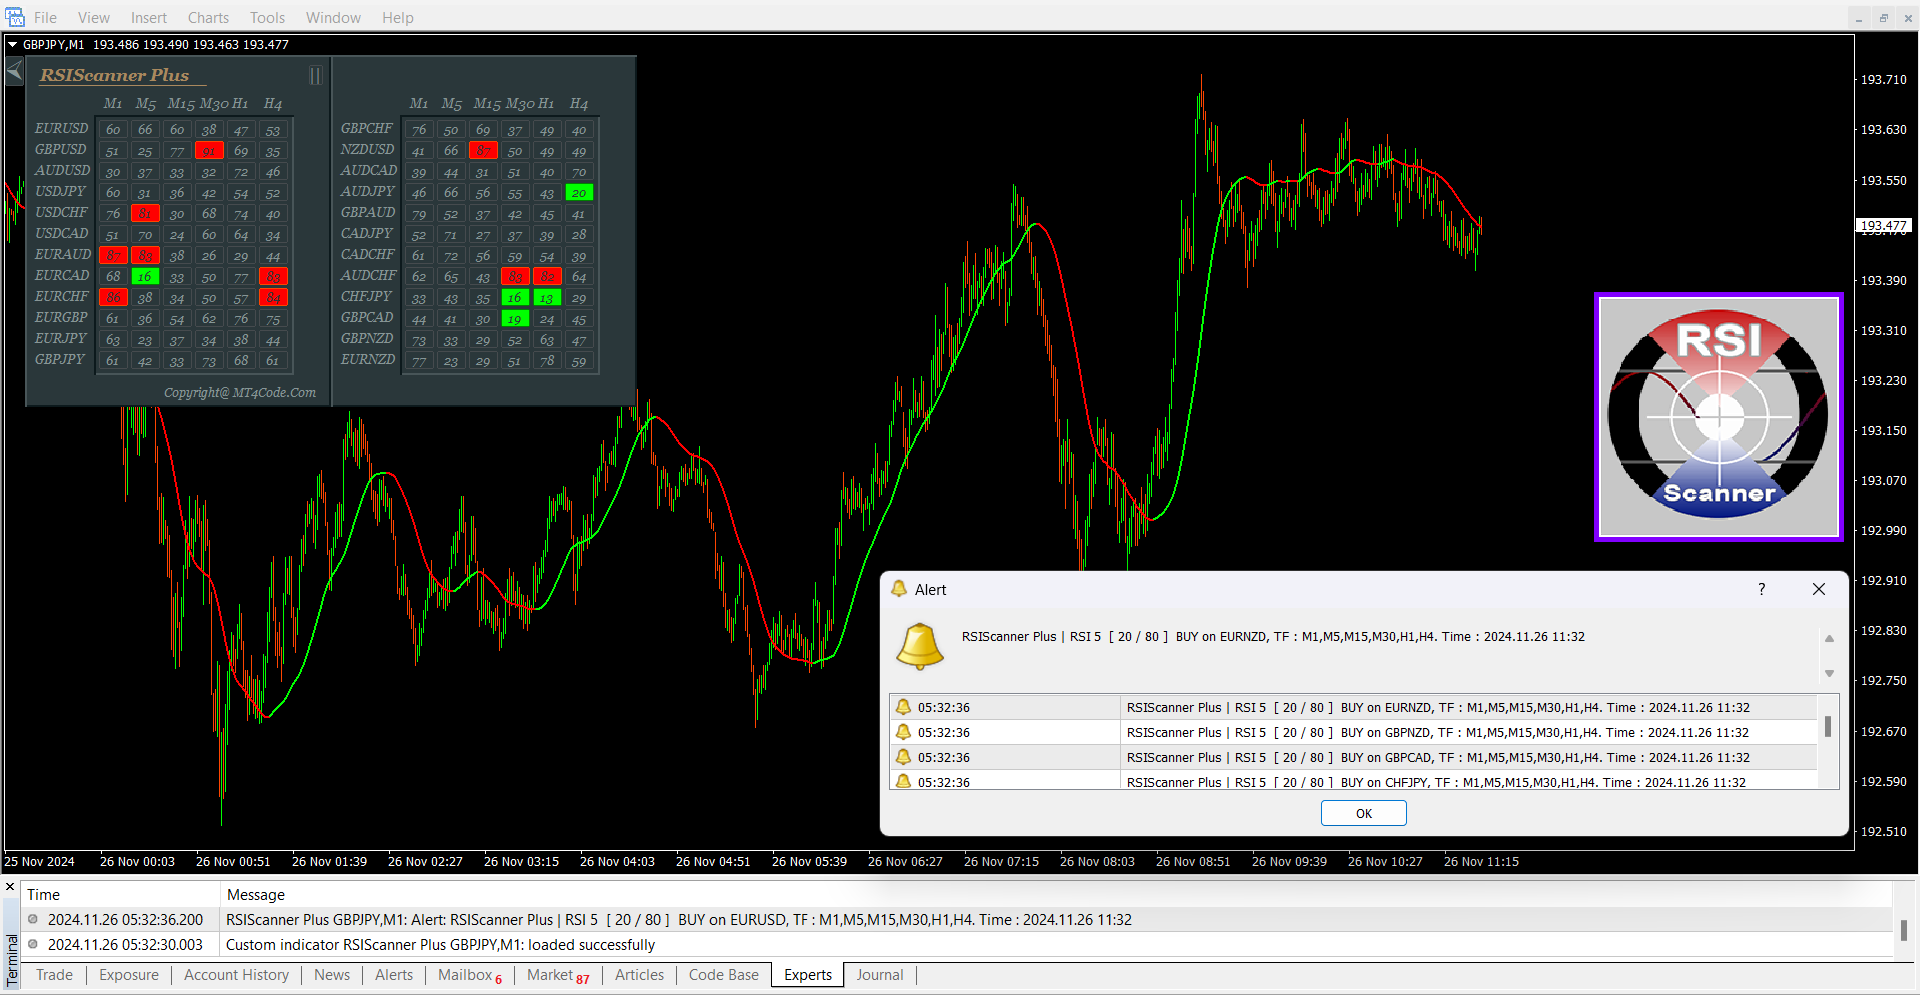
Each box in the dashboard is clickable, allowing you to instantly open the corresponding symbol and timeframe on the chart.
-
-
Hide/Show Dashboard:
-
You can easily toggle the visibility of the dashboard on the chart to avoid cluttering your screen while analyzing other indicators.
-
-
Customizable Colors:
-
The colors of the boxes and trend lines are customizable. For example:
-
Blue Box = Oversold
-
Red Box = Overbought
-
Blue Trend Line = Uptrend
-
Red Trend Line = Downtrend
-
-
-
RSI Values Display:
-
The indicator shows the RSI values for each symbol and timeframe, helping you monitor overbought and oversold conditions.
-
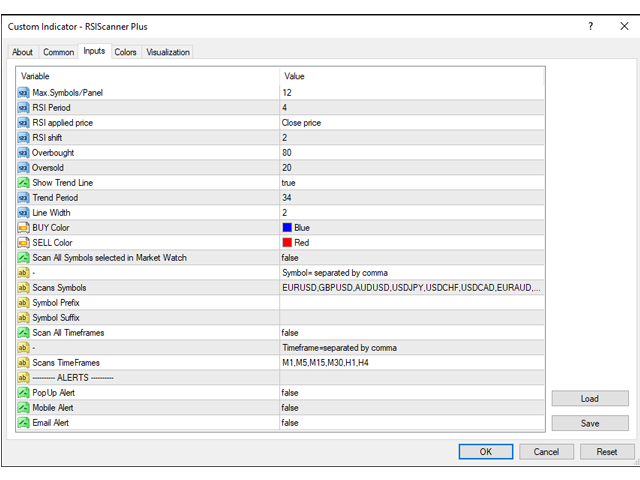
Parameter Settings:
-
Max.Symbols/Panel: Number of symbols to display in the panel.
-
RSI Period: The RSI period (default is 4).
-
RSI Applied Price: Choose the RSI applied price (default is PRICE CLOSE).
-
RSI Shift: Set the RSI shift for scanning.
-
Overbought: The RSI value considered overbought.
-
Oversold: The RSI value considered oversold.
-
Show Trend Line: Option to show or hide the trend line.
-
Trend Period: Set the period for calculating the trend.
-
Line Width: Set the width of the trend line.
-
BUY Color: Customize the color of the uptrend line and oversold boxes.
-
SELL Color: Customize the color of the downtrend line and overbought boxes.
-
Scan All Symbols in Market Watch: If enabled, the indicator will scan all symbols in your market watch list.
-
Scans Symbols: Manually specify which symbols to scan.
-
Symbol Prefix/Suffix: Add prefix or suffix for symbols (e.g., EURUSD.ecn).
-
Scan All Timeframes: If enabled, it will scan all timeframes (M1 to Monthly).
-
Scans Timeframes: Manually specify which timeframes to scan.
-
Minimum Total TFs to Alert/Symbol: Set the minimum number of timeframes in which the price must be overbought or oversold to trigger an alert.
-
PopUp Alert: Enable or disable pop-up alerts on the chart.
-
Mobile Alert: Enable or disable mobile alerts on MT4.
-
Email Alert: Enable or disable email alerts for overbought/oversold conditions.
Trading Strategies Using RSI Scanner Plus:
-
Higher Trend Lower RSI Strategy:
-
Concept: Follow the higher timeframe trend (e.g., H1), and look for oversold/overbought conditions on lower or same timeframes (e.g., H1, M30, M15).
-
Entry: Enter a buy when the price is oversold and the trend is up. Enter a sell when the price is overbought and the trend is down.
-
Stop Loss and Take Profit: Place your stop loss below the recent price low (for buys) or above the recent price high (for sells), and set the take profit 1 to 2 times the stop loss distance.
-
-
All Over Strategy:
-
Concept: Enter a trade when at least 3 timeframes are showing overbought or oversold conditions.
-
Entry: For example, if M1, M5, and M15 are all oversold, enter a buy order.
-
How RSI Scanner Plus Can Help Your Trading:
Whether you are already familiar with trading strategies based on the RSI or are looking to implement a new one, the RSI Scanner Plus provides valuable insights that will help you make more informed trading decisions. The real-time RSI data from multiple timeframes, combined with trend lines and customizable alerts, empowers you to track the market efficiently.