Sale!

S/R Zones Trendlines

Original price was: $23.00.Current price is: $9.00.

It works like a magic!

As a trader, I found this tool useful for spotting market trends and making informed decisions. The real-time data and clear chart patterns help identify potential trade opportunities.

Christina K

Verified Purchase

INSTANT DOWNLOAD!

Original Price: $23.00

Our price: $9.00   61% OFF Retail!

Indicator: PerfectZones_AR.ex4, Template: SR Zones.tpl, File: dfx_perfectzones.key, UserGuide: SR ZONES – System Manual.pdf.


S/R Zones Indicator: Advanced Support/Resistance Tool for Precision Trading

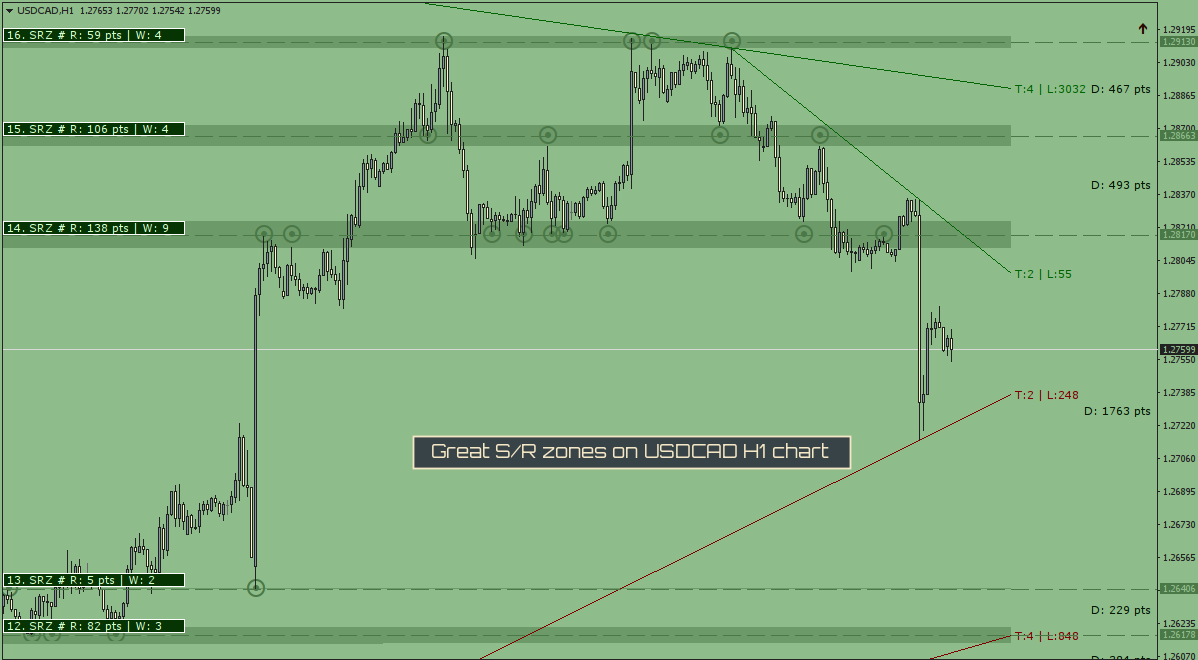
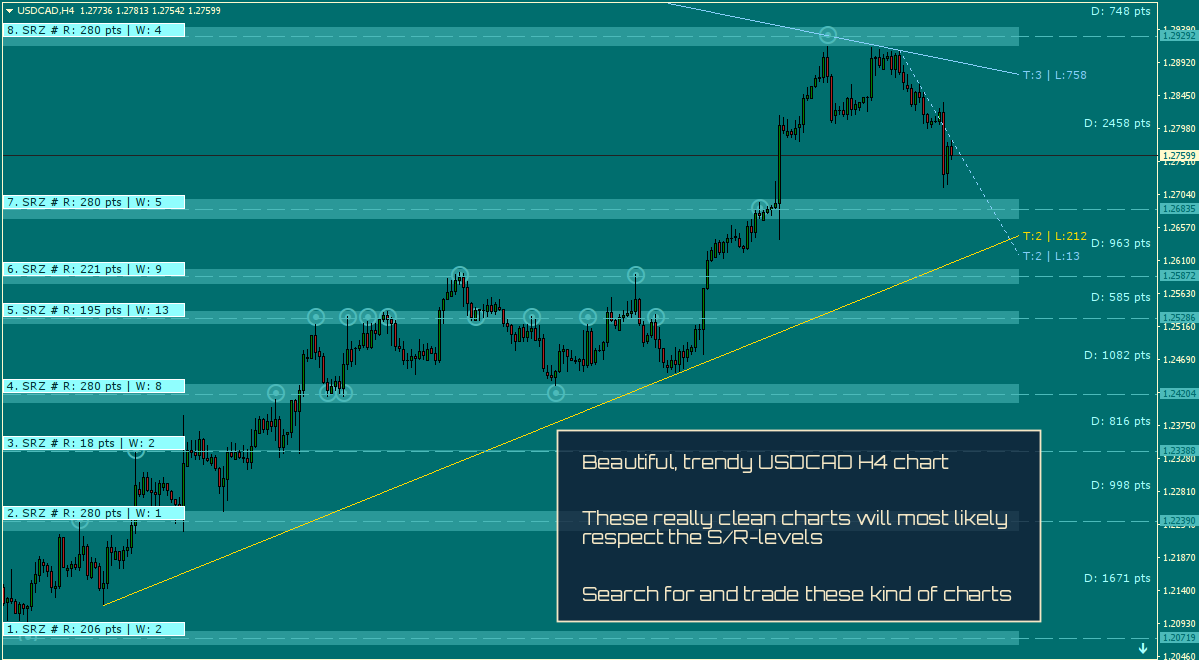
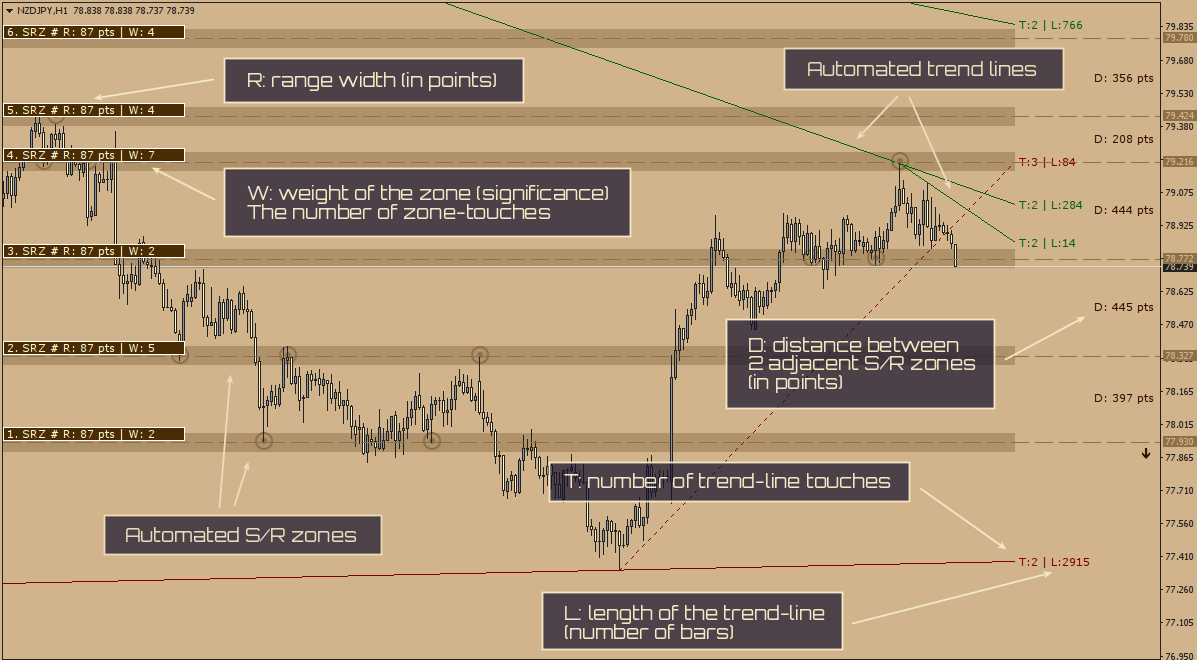
The S/R Zones indicator is a highly advanced tool designed to automatically draw support/resistance (S/R) zones and trend lines on your chart. It’s a classic and essential tool that simplifies your trading strategy with a unique calculation method for precision.

Key Features:

  • Automatic S/R Zone Detection
    The indicator automatically identifies and draws key support and resistance zones for you, saving you time and ensuring accuracy.

  • Trend Line Visualization
    It also automatically draws trend lines, highlighting important market movements.

  • Broken but Relevant Trend Lines
    Even after a trend line is broken, the indicator keeps displaying it as a dotted line, ensuring you stay informed about previous market trends.

  • Customizable Intervals
    Adjust the number of bars for the S/R zones and trend lines, allowing for tailored analysis based on your trading preferences.

Why Choose the S/R Zones Indicator?

This tool brings automation and precision to your trading, helping you quickly spot important support and resistance levels while also tracking market trends. Whether you’re a beginner or a seasoned trader, this indicator streamlines your technical analysis, so you can focus on making the best trades.

Ready to trade smarter with automated support and resistance zones? Get the S/R Zones Indicator today and enhance your trading accuracy!

CLEAN Indicator: Precision Support/Resistance and Trend Line Analysis

The CLEAN indicator is designed to provide deep insights into market behavior by calculating and displaying key metrics for support/resistance (S/R) zones and trend lines.

Key Features:

  • Support/Resistance Range
    Displays the range of S/R zones in points, giving you a clear view of price movement.

  • Zone Weight
    Calculates the ‘weight’ of each S/R zone, helping you identify which zones are the most significant (higher values indicate stronger zones).

  • Adjacent Zone Distance
    Measures the distance between two adjacent S/R zones in points.

  • Trend Line Length
    Shows the length of trend lines in terms of the number of bars, helping you gauge their importance.

  • Trend Line Touches
    Tracks how many times the trend line has been touched by price, with more touches indicating a stronger trend line.

  • No More S/R Zones Indicator
    Highlights when there are no more S/R zones in a given direction by displaying an arrow, giving you an early warning to adjust your strategy.

Why CLEAN?

With CLEAN, you get a comprehensive view of market trends and key support/resistance zones, making it easier to spot potential price movements and adjust your strategy accordingly. This indicator adds an extra layer of precision to your technical analysis, whether you’re trading short-term or long-term.

Trade smarter and more effectively with CLEAN. Get your indicator today!

EFFECTIVE Indicator: Customizable Support/Resistance and Trend Line Analysis

The EFFECTIVE indicator is designed to provide powerful and customizable support/resistance (S/R) zone and trend line analysis, offering you full control over your trading environment.

Key Features:

  • Selectable Sensitivity
    Choose from 2 sensitivity grades to adjust how the indicator detects and displays support and resistance zones, allowing for greater flexibility.

  • Adjustable Trend Line Style
    Tailor the trend line style to your preferences, making it easier to integrate the indicator with your trading strategy.

  • Automatic S/R Zone Color Calculation
    The indicator automatically calculates the colors of S/R zones based on the chart’s background color, ensuring a seamless and visually cohesive trading experience.

  • Customizable Trend Line Colors
    Easily adjust the colors of trend lines to suit your visual preferences, helping you keep track of multiple trends at a glance.

Why Choose EFFECTIVE?

With EFFECTIVE, you gain a high level of customization and precision in your technical analysis. The ability to adjust sensitivity and color settings allows for a more personalized trading experience, helping you stay focused and make better-informed decisions.

Customize your chart, enhance your strategy, and trade more effectively with EFFECTIVE. Get it now!

Scroll to Top