INSTANT DOWNLOAD!
Original price: $60.00
Our price: $15.00 77% OFF Retail!
Indicator: Up Down No DLL.ex4 v10 (Unlocked MT4 Build 1420+), NO MANUAL.
Up-Down Indicator — Reliable, Non-Repainting Signals for All Pairs and Timeframes
The Up-Down Indicator is a powerful trading tool designed to work on all currency pairs and is effective on timeframes below the weekly chart, including 1-minute charts. It provides strong, long-term signals without flooding you with too many alerts.
How It Works
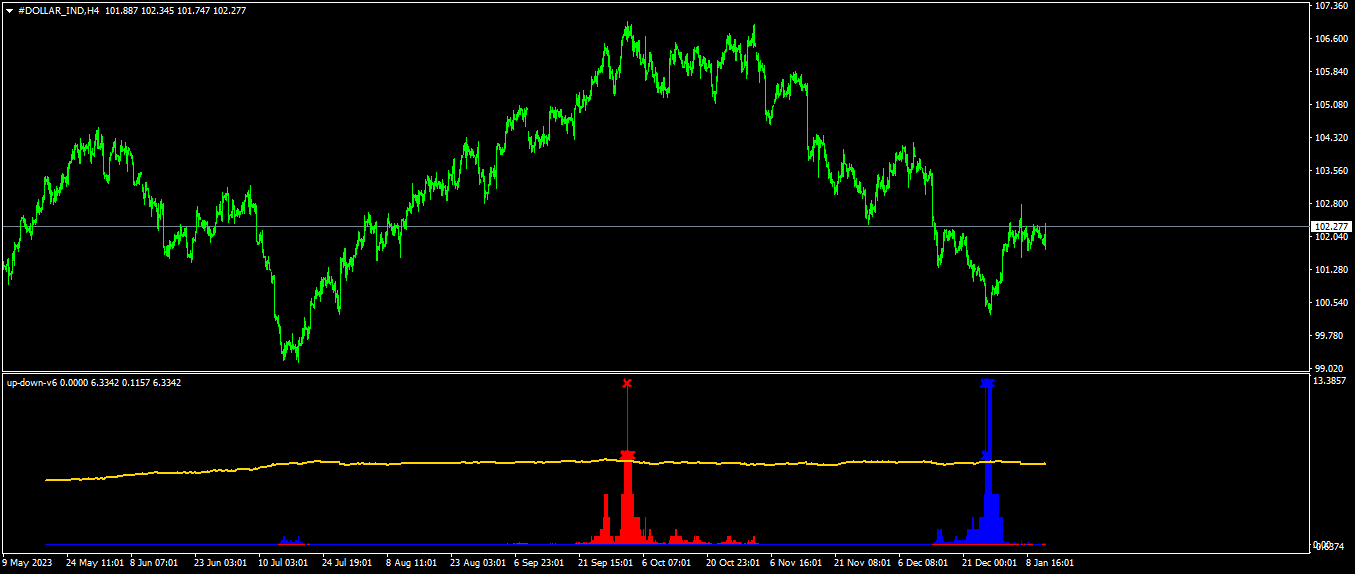
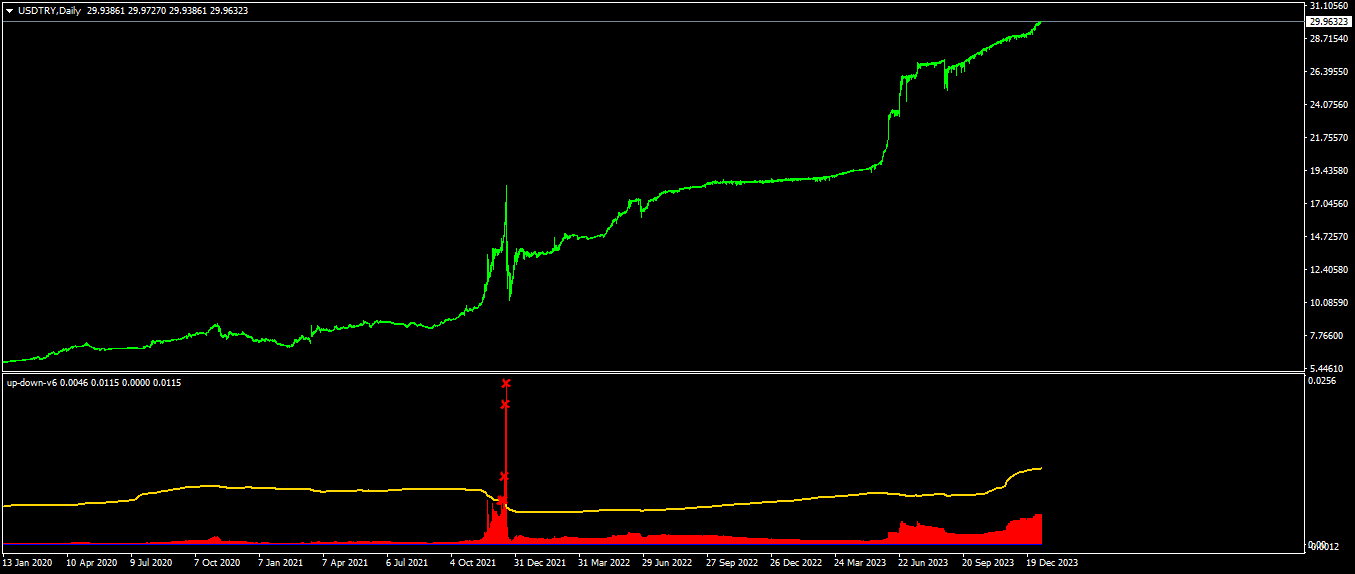
When the red histogram crosses above the trigger line, this generates an up signal—indicating the price is likely to move down shortly after.
When the blue histogram crosses above the trigger line, this generates a down signal—indicating the price is likely to move up.
This counterintuitive setup helps you anticipate price reversals using a mathematical approach to price action.
Key Features
Non-Repainting: Signals stay fixed and do not change after they appear, ensuring reliable trade entries.
Works on All Pairs: Compatible with every currency pair.
Flexible Timeframes: Effective on timeframes lower than weekly, including M1, M15, H4, and daily charts.
Long-Hold Signals: Designed to hold trades longer, focusing on quality over quantity—so it won’t overwhelm you with too many signals.
Customizable ‘C Value’:
Default value: 2.7
You can adjust this ‘c value’ up or down depending on the currency pair and timeframe for better signal accuracy.
It’s recommended to find the best ‘c value’ by analyzing signals on daily or H4 charts, then apply the same value on lower timeframes.
Processing Adjustment for Weekly Charts:
Because weekly charts have fewer data points, reduce the processing value from 1000 to a minimum of 500 for smoother performance.
How to Use
If no signals appear on your current chart, press the ‘+’ button in the terminal to check the weekly chart.
Adjust the ‘c value’ based on the pair and timeframe to fine-tune the indicator’s sensitivity.
When a signal appears on any timeframe, follow the indicated direction accordingly.
Important Note
This indicator is based on a mathematical model to identify likely turning points in price movement. However, it does not guarantee a winning trade and should be used alongside proper risk management and other trading tools.